 Class
21a Research II: Looking for Links; Evaluating
Research-Flaws, Placebo
Last updated: October 8, 2026
|
PSY
101
Class
21a Research II: Looking for Links; Evaluating
Research-Flaws, Placebo Last updated: October 8, 2026
|
|
Looking For Links: Descriptive or Correlational Research
Descriptive or Correlational research can tell us if there is a link between variables, but not about cause and effect relationships
- Do overweight people exercise less than normal weight people? (weight vs. exercise)
- Do people in the US South live fewer years than people in the North? (location vs. life expectancy)
- Do angry people have more heart attacks than peaceful people (emotion vs. heart disease)
- Do step-fathers treat their step-children worse than their natural children (biological relatedness vs. parental care)
Correlation coefficient (= r)
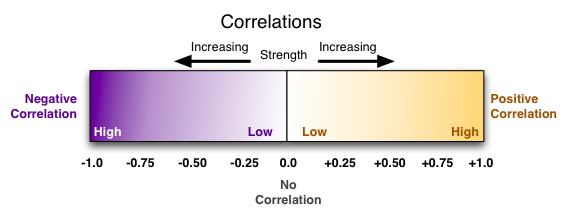
- A numerical index between -1 and +1 which expresses the strength of relationship between two variables (correlation coefficient is labeled "r")
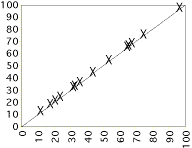
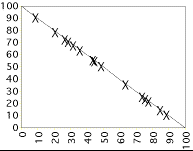
Correlation (r) = -1.00 Correlation (r) = +0.05 Correlation (r) = +1.00
Positive Correlation: As the measure of one variable grows larger, the measure of the other variable grows larger. Both grow or decrease in the same direction. Here are some examples of positive correlations:
* N = neuroticism, E = extraversion, O = openness to experience, A = agreeableness, C = conscientiousness
- Grade point average and SAT scores
- Self-esteem and academic grades
- Big 5 Personality traits (N-E-O-A-C*) as young adult & old adult (r = +0.65)
- Conscientiousness (personality trait) & occupational success ratings by supervisors (e.g., police, sales associates)
- Current life satisfaction & memories of bad experiences turning into good/emotionally positive outcomes during youth
- Age and number of medical conditions
- Hours in direct sunlight and severity of sunburn
- College graduates and frequency of using the word "cafe" online (see diagram)
Negative Correlation: As the measure of one variable grows larger, the measure of the other variable grows smaller. Each variable move in the opposite direction of the other variable. Here are some examples of negative correlations:
- Personal wealth and prevalence of psychiatric disorders
- Absence from class and grade point average
- Temperature and sales of coats in stores
- Amount of exercise and the percentage of body fat
- Self-esteem & memories of bad/negative scenes in youth
- The Physical Attractiveness Bias or the Attraction-Leniency Bias
- Physical attractiveness & size of UK court fines for misdemeanor offenses (Downs & Lyons, 1991). More attractive people paid lower fines for the same crimes than less attractive people.
- In another study (Gunnell & Ceci, 2010), US college students evaluated the data of a criminal trial and were shown photographs of the putative defendant. Acting as jury, participants who saw a defendent who was not physically attractive tended to suggest a jail term more than 3 years longer than those who judged a defendant who was physically attractive.
- Happiness & Obesity (see diagram on right). Increasing levels of happiness in large American cities was associated with decreasing levels of obesity.
As a correlation moves from 0.0 toward +1.0 (more positive), the strength of the relationship increases. Similarly, as a correlation moves from 0.0 toward -1.0 (more negative), the strength of the relationship increases. Correlations near a value of 0.00 indicate that there is little to no relationship between two variables.Correlations say that there is a relationship, NOT that one variable CAUSES the other. It is possible that both variables are actually caused by a third or fourth variable.
Hence, the correlation -0.90 is larger/stronger than the correlation +0.75. The correlations of +0.63 and -0.63 are exactly the same magnitude but in opposite directions. They are equally "strong".
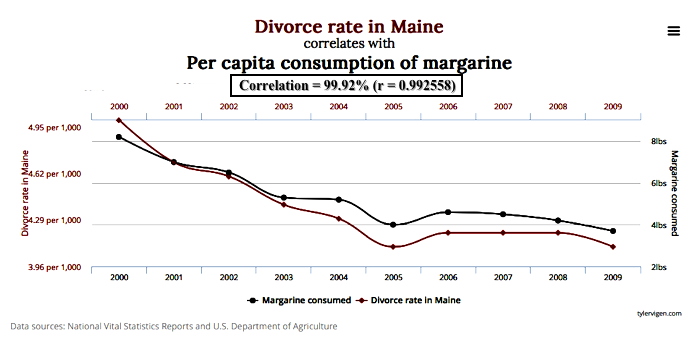
NOT IN BOOK: In doing correlation research, a researcher should have a reason to suspect that a relationship between two variables might exist. In the absence of ANY plausible reason for why two variables might be related, sometimes there are data which show what are called "spurious correlations" ("spurious" means "false, not real, seemingly related but not").
One of the most widely cited examples of a spurious correlation shows almost a perfect relationship between the rate of divorce in the state of Maine between 2000 and 2009 and the per capita consumption of margarine in the U.S. in the same period.
![{Zero Correlation]](../psy101graphics/cor0.gif)