Last updated: October 7, 2025
| PSY
101
Last updated: October 7, 2025
|
||
Looking For Links: Descriptive/Correlational Research (Outline)
Descriptive or Correlational research can tell us if there is a link between variables, but not about cause/effect relationships
- Do people in the South live fewer years than people in the North? (location vs. life expectancy)
- Do angry people have more heart attacks than peaceful people (emotion vs. heart disease)
- Do step-fathers treat their step-children worse than their natural children (biological relatedness vs. parental care)
- Do more hours of athletic practice lead to more successful athletic performance? (practice vs. success)
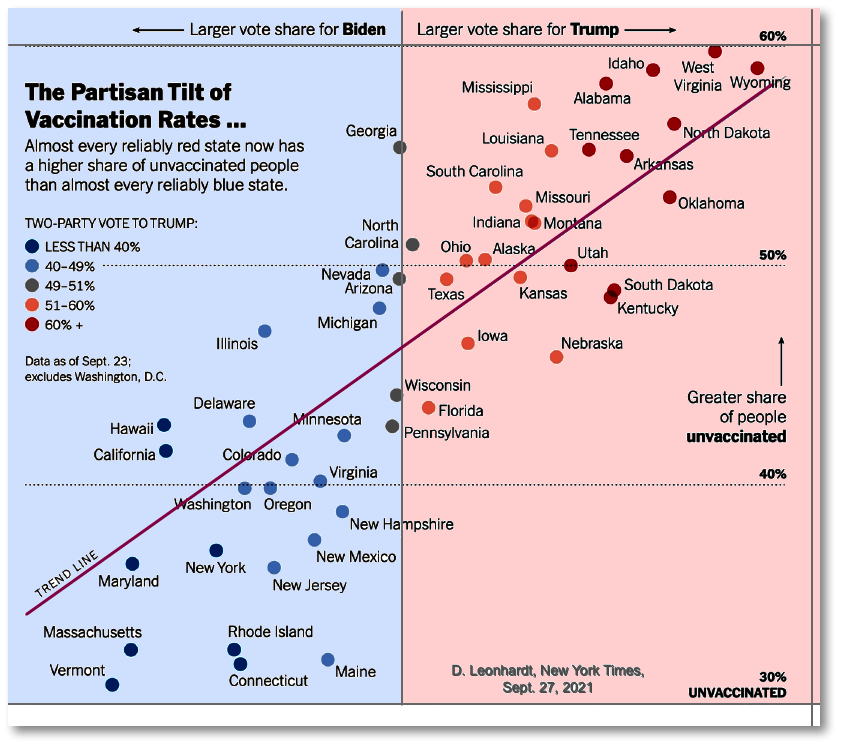
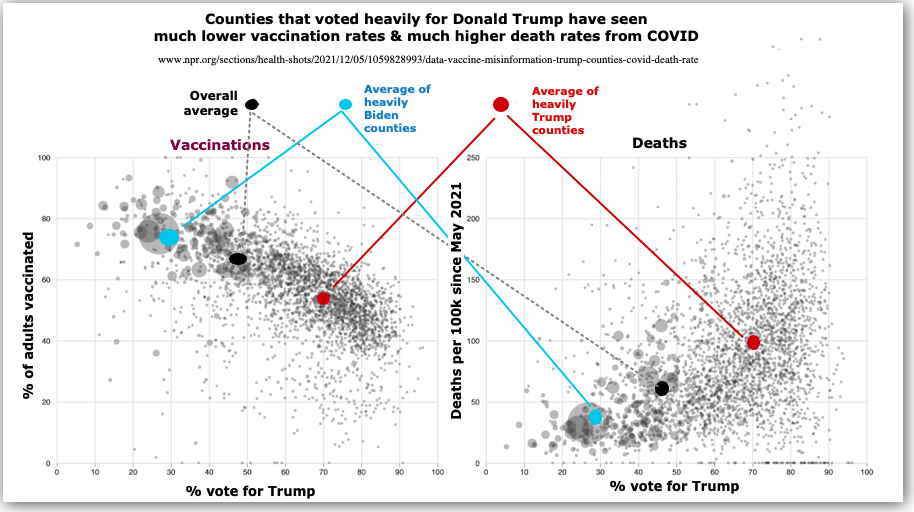
The data are clear. Yes, they are related. People living in areas where voters went for Trump in the 2020 election were significantly less likely to be vaccinated against COVID-19 AND significantly more likely to die of COVID-19 than people living in areas where voters went for Biden.
Does this mean that somehow Trump CAUSED the lower vaccination rates? Or, conversely, did the higher death rates somehow CAUSE people to vote for Trump rather than Biden? Perhaps, but we cannot say so on the basis of this evidence. They simply show that there is some sort of relationship or link.
- Structural inequalities across the nation in the distribution of health care
- Distrust of government and its official health messages
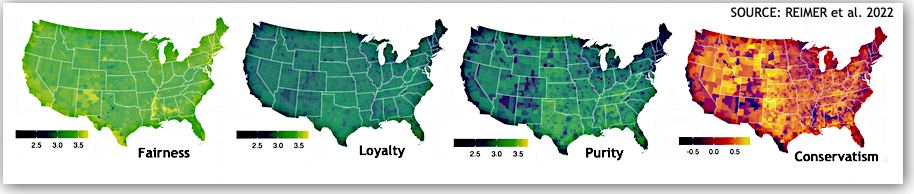
Moral Foundations Theory (MFT): Different parts of the US have differing value systems and political tendencies. Various moral beliefs or intuitions about what is right relate to both health and political behaviors. Research into MFT (Reimer et al. 2022) has found:
- Basic moral intuitions or beliefs in the importance of "PURITY" [that is, "physical and spiritual cleanliness, self-discipline, dignity, valuing sacredness, and suppressing carnal desires" is related to the low vaccination/high death rates over and above political beliefs
- Basic moral intuitions in the importance of LOYALTY ["concerns of unity, solidarity, togetherness, family, and in-group protection"] and FAIRNESS ["concerns of equality, justice, reciprocity, and proportionality" are related to HIGHER vaccination/LOWER death rates over and above political beliefs.
Correlation coefficient (r)
A numerical index between -1 and +1 which expresses the strength of relationship between two variables (correlation coefficient is labeled "r")
Correlation (r) = -1.00 Correlation (r) = +0.05 Correlation (r) = +1.00
Positive Correlation: As the measure of one variable grows larger, the measure of the other variable grows larger. Both grow or decrease in the same direction. Here are some examples of positive correlations:
* N = neuroticism, E = extraversion, O = openness to experience, A = agreeableness, C = conscientiousness
- Grade point average and SAT scores
- Self-esteem and academic grades
- Big 5 Personality traits (N-E-O-A-C*) as young adult & old adult (r = +0.65)
- Conscientiousness (personality trait) & occupational success ratings by supervisors (e.g., police, sales associates)
- Current life satisfaction & memories of bad experiences turning into good/emotionally positive outcomes during youth
- Age and number of medical conditions
- Hours in direct sunlight and severity of sunburn
- College graduates and frequency of using the word "cafe" online (see diagram)
Negative Correlation: As the measure of one variable grows larger, the measure of the other variable grows smaller. Each variable move in the opposite direction of the other variable. Here are some examples of negative correlations:
- Personal wealth and prevalence of psychiatric disorders
- Absence from class and grade point average
- Temperature and sales of coats in stores
- Amount of exercise and the %age of body fat
- Self-esteem & memories of bad/negative scenes in youth
- The Physical Attractivensss Bias or the Attraction-Leniency Bias
- Physical attractiveness & size of UK court fines for misdemeanor offenses (Downs & Lyons, 1991)
- Physically unattractive defendants get longer jail sentences than physically attractive ones
- Happiness & Obesity (see diagram on right)
As a correlation moves from 0.0 toward +1.0 (more positive), the strength of the relationship increases. Similarly, as a correlation moves from 0.0 toward -1.0 (more negative), the strength of the relationship increases. Correlations near a value of 0.00 indicate that there is little to no relationship between two variables.Correlations say that there is a relationship, NOT that one variable CAUSES the other. It is possible that both variables are actually caused by a third or fourth variable. Or, even, the relationship is purely accidental.
Hence, the correlation -0.90 is larger or stronger than the correlation +0.75.
The correlations of +0.63 and -0.63 are exactly the same magnitude but in opposite directions. They are equally "strong".
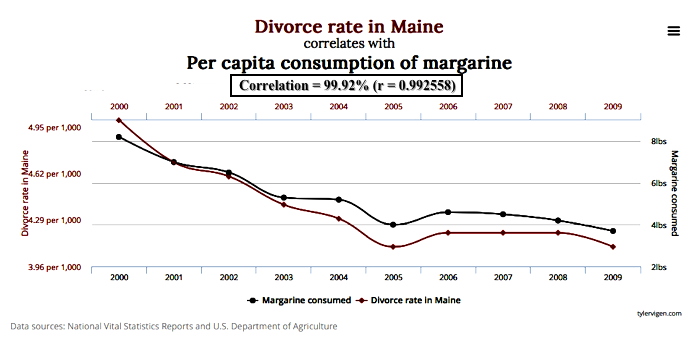
Spurious Correlations: Data may show a relationship between two variables where none really exists. These are "spurious" (= false) correlations. A researcher should have a reason to believe that two variables might be related. Here are two examples of spurious correlations:
Other forms of Descriptive Research
- Naturalistic Observation: Examine behavior in a natural setting without interfering
- Case Studies: An in-depth examination of one or a small number of individuals
- Surveys: The use of questionnaires or interviews to gather information from participants about their behaviors, attitudes, and judgments
Flaws: Evaluating Research
Sampling Bias: Is the sample representative of the population under review?
- Who is supposed to be represented in your study, that is, to whom is this study supposed to generalize?
- Bias can be introduced by
- Using convenience samples (your friends, your family, etc.) to serve as participants
- Using any non-random mechanism by which to assign participants to experimental conditions, for example, using the alphabet to assign participants, calling for volunteers, etc.
Placebo Effects: Changes in a person's behavior which come from the EXPECTATION of change, rather than the ingredients or components of the treatment they receive.
Distortions in Self-Report Data: Bias introduced by participants who respond in ways that do not reflect their actual behavior, beliefs, judgments, etc.
- Social Desirability: Give answers which reflect favorably on yourself
- Misunderstood or poorly worded questions
- "Response sets" = participant responds in a stereotypical or automatic ways
- Halo Effect
- Leniency-Severity-Generosity Effects
- Extremist or Central Tendency response set: rate everything as terrible or excellent, or as average
Experimenter Bias
- "Double-blind" Research: (the GOLD standard) In such an approach to research, neither the participants nor the data collectors know which participants are in the experimental group or in the control group.
Looking at Ethics
The question of deception
Animal Research
Ethical Principles in Research with Human Subjects
- Participation in research by people must be voluntary and they must be allowed to withdraw from a study at any time. Participants must give their written consent to participate in any research.
- Human participants in studies cannot be harmed or subject to dangerous treatments
- Note that in some medical (not psychological) research, very sick patients may be asked to participate in studies that may be dangerous to their health because that patient is already quite sick and the experimental treatment might be beneficial to them.
- If deception is used, all participants must be debriefed and told about the actual purpose of the experiment as soon as possible after it is finished
- Participants have a complete right to privacy and any identifying information must be removed from the results of a study
![[Correlation]](../psy101graphics/Correlation.jpg)
![[Negative Correlation]](../psy101graphics/cor-1.gif)
![{Zero Correlation]](../psy101graphics/cor0.gif)
![[Positive Correlation]](../psy101graphics/cor_positive1.gif)