Last updated: October 7, 2025
| PSY
101
Last updated: October 7, 2025
|
||
Looking For Links: Descriptive or Correlational Research
Descriptive or Correlational research can tell us if there is a link between variables, but not about cause and effect relationships
- Do overweight people exercise less than normal weight people? (weight vs. exercise)
- Do people in the US South live fewer years than people in the North? (location vs. life expectancy)
- Do angry people have more heart attacks than peaceful people (emotion vs. heart disease)
- Do step-fathers treat their step-children worse than their natural children (biological relatedness vs. parental care)
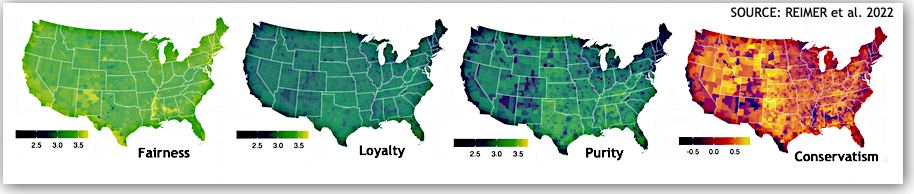
As you can see in the maps above of the 3000+ counties of the US, different regions of the United States are marked by differences in people's basic moral intuitions or beliefs according to Moral Foundations Theory (MFT) which, in turn, affect how people tend to behave. And, no surprise, there are clear political differences in the nation of areas that are more or less conservative politically (the more yellow areas above are more conservative and the purple areas are more liberal).
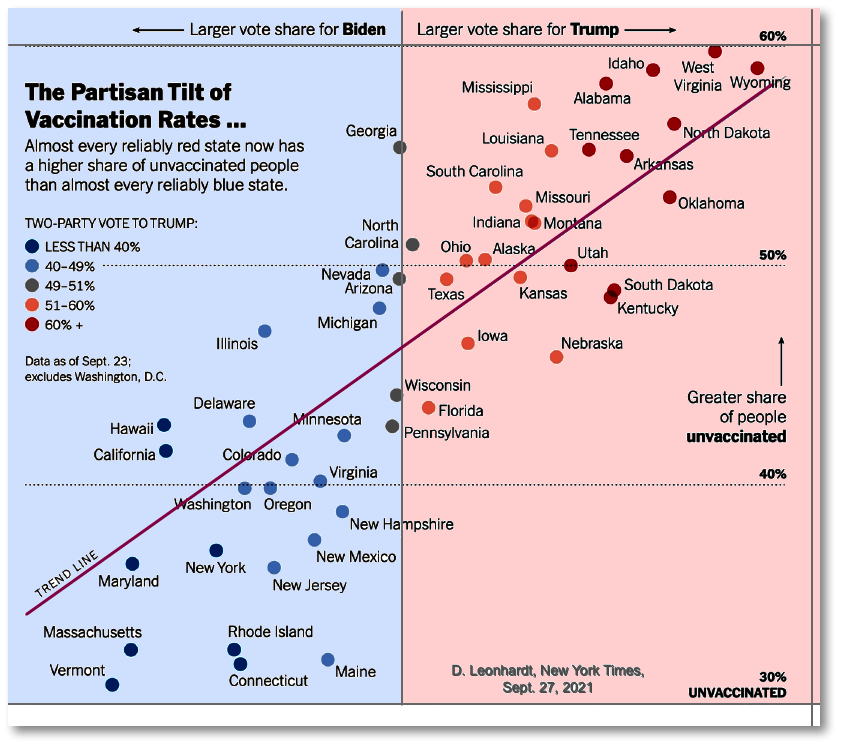
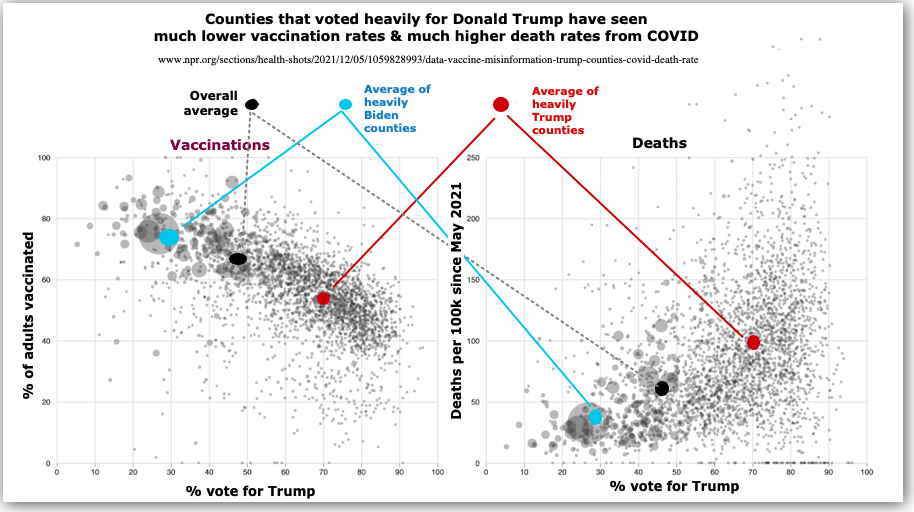
Using MFT, researchers have uncovered a set of links between various basic moral beliefs and the likelihood of vaccination or dying from COVID-19 (Reimer et al. 2022)
- Basic moral intuitions or beliefs in the importance of "PURITY" [that is, "physical and spiritual cleanliness, self-discipline, dignity, valuing sacredness, and suppressing carnal desires" (Reimer et al. 2022, p. 754)] is related to the low vaccination/high death rates over and above political beliefs
- Basic moral intuitions in the importance of LOYALTY ["concerns of unity, solidarity, togetherness, family, and in-group protection"] and FAIRNESS ["concerns of equality, justice, reciprocity, and proportionality" (Reimer, p. 754)] are related to HIGHER vaccination/LOWER death rates over and above political beliefs.
Correlation coefficient (= r)
- A numerical index between -1 and +1 which expresses the strength of relationship between two variables (correlation coefficient is labeled "r")
Correlation (r) = -1.00 Correlation (r) = +0.05 Correlation (r) = +1.00
Positive Correlation: As the measure of one variable grows larger, the measure of the other variable grows larger. Both grow or decrease in the same direction. Here are some examples of positive correlations:
* N = neuroticism, E = extraversion, O = openness to experience, A = agreeableness, C = conscientiousness
- Grade point average and SAT scores
- Self-esteem and academic grades
- Big 5 Personality traits (N-E-O-A-C*) as young adult & old adult (r = +0.65)
- Conscientiousness (personality trait) & occupational success ratings by supervisors (e.g., police, sales associates)
- Current life satisfaction & memories of bad experiences turning into good/emotionally positive outcomes during youth
- Age and number of medical conditions
- Hours in direct sunlight and severity of sunburn
- College graduates and frequency of using the word "cafe" online (see diagram)
Negative Correlation: As the measure of one variable grows larger, the measure of the other variable grows smaller. Each variable move in the opposite direction of the other variable. Here are some examples of negative correlations:
- Personal wealth and prevalence of psychiatric disorders
- Absence from class and grade point average
- Temperature and sales of coats in stores
- Amount of exercise and the percentage of body fat
- Self-esteem & memories of bad/negative scenes in youth
- The Physical Attractiveness Bias or the Attraction-Leniency Bias
- Physical attractiveness & size of UK court fines for misdemeanor offenses (Downs & Lyons, 1991). More attractive people paid lower fines for the same crimes than less attractive people.
- In another study (Gunnell & Ceci, 2010), US college students evaluated the data of a criminal trial and were shown photographs of the putative defendant. Acting as jury, participants who saw a defendent who was not physically attractive tended to suggest a jail term more than 3 years longer than those who judged a defendant who was physically attractive.
- Happiness & Obesity (see diagram on right). Increasing levels of happiness in large American cities was associated with decreasing levels of obesity.
As a correlation moves from 0.0 toward +1.0 (more positive), the strength of the relationship increases. Similarly, as a correlation moves from 0.0 toward -1.0 (more negative), the strength of the relationship increases. Correlations near a value of 0.00 indicate that there is little to no relationship between two variables.Correlations say that there is a relationship, NOT that one variable CAUSES the other. It is possible that both variables are actually caused by a third or fourth variable.
Hence, the correlation -0.90 is larger/stronger than the correlation +0.75. The correlations of +0.63 and -0.63 are exactly the same magnitude but in opposite directions. They are equally "strong".
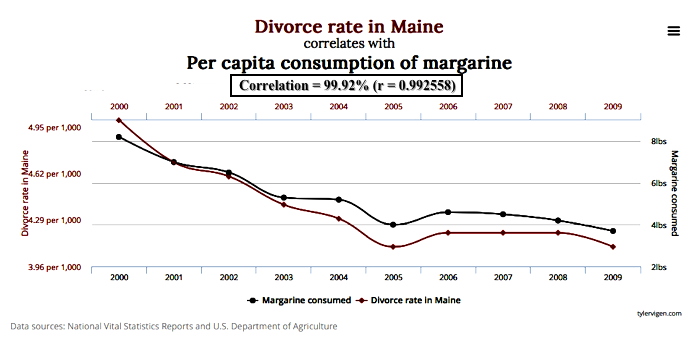
NOT IN BOOK: In doing correlation research, a researcher should have a reason to suspect that a relationship between two variables might exist. In the absence of ANY plausible reason for why two variables might be related, sometimes there are data which show what are called "spurious correlations" ("spurious" means "false, not real, seemingly related but not").
One of the most widely cited examples of a spurious correlation shows almost a perfect relationship between the rate of divorce in the state of Maine between 2000 and 2009 and the per capita consumption of margarine in the U.S. in the same period.
There is a large list of more and often very funny spurious correlations at this website.
Other forms of Descriptive Research
- Naturalistic Observation: Examine behavior in a natural setting without interfering
- Case Studies: An in-depth examination of one or a small number of individuals
- Surveys: The use of questionnaires or interviews to gather information from participants about their behaviors, attitudes, and judgments
Flaws: Evaluating Research
Sampling Bias: Is the sample representative of the population under review?
- Who is supposed to be represented in your study, that is, to whom is this study supposed to generalize?
Bias can be introduced by
- Using convenience samples (your friends, your family, etc.) to serve as participants
- Using any non-random mechanism by which to assign participants to experimental conditions, for example, using the alphabet to assign participants, calling for volunteers, etc.
Consider the infamous 1936 Literary Digest "poll" which predicted that Alf Landon would beat Franklin D. Roosevelt in the presidential election by 57% to 43% (and win a landslide 370 electoral votes!) The magazine had contacted 10 million Americans (whose names were drawn from long lists of people who owned cars or telephones). The magazine got back over 2 million responses. Of course, in the actual election, Roosevelt beat Landon by 61% of the votes (523 electoral votes vs. 8 electoral votes for Landon)
What did the Literary Digest do wrong?
- Used a biased sample: in the midst of the Great Depression, many more rich people owned cars and telephones than poor people
- Used a voluntary sample: people who were angry at Roosevelt's first term were more likely to send in a postcard ballot to the magazine than those who weren't angry.
See The First Measured Century (PBS): George Gallup and the Scientific Opinion Poll
Placebo Effects: Changes in a person's behavior which come from the EXPECTATION of change, rather than the ingredients or components of the treatment they receive.
- Research has shown that these effects can be quite strong.
- "Nocebo" Phenomenon: Averse effects or negative changes in behavior (health, outcome, etc.) after taking a placebo.
- As Wikipedia (2/26/2018) describes "In the narrowest sense, a nocebo response occurs when a drug-trial subject's symptoms are worsened by the administration of an inert, sham, or dummy treatment, called a placebo…The worsening of the subject's symptoms or reduction of beneficial effects is a direct consequence of their exposure to the placebo, but those symptoms have not been chemically generated by the placebo."
Distortions in Self-Report Data: Bias introduced by participants who respond in ways that do not reflect their actual behavior, beliefs, judgments, etc.
- Social Desirability: Give answers which reflect favorably on yourself
- Willingness to admit small mistakes, common human failings, etc. VS. trying to appear perfect, for example,
- I've never told a lie. True or False?
- I've always done my homework on time. True or False?
- I always complete the readings for my college classes ahead of time. True or False?
- You can download the Crowne & Marlow Social Desirability Scale in pdf format and score yourself.
- Misunderstood or poorly worded questions
- "Response sets" = participant responds in a stereotypical or automatic ways
- Halo Effect: this is the tendency to rate someone or something positively (or negatively) on many different items from knowledge about one item. For example, you see someone help carry the groceries for an elderly person and conclude that the person is also trustworthy, friendly, and a hard worker.
- Leniency-Severity-Generosity Effects
- Extremist or Central Tendency response set: rate everything as terrible or excellent, or as average
Experimenter Bias: Bias introduced when a researcher's expectations or preferences influence the outcome of the research. This may be done without the research ever realizing that he/she is affecting the outcome.
- "Double-blind" Research: (the GOLD standard) In such an approach to research, neither the participants nor the data collectors know which participants are in the experimental group or in the control group.
============================
Looking at Ethics
Psychology studies human beings and we humans are a very complex reality to study. We are often smart enough to understand the purpose of a research study in ways that would make that study invalid. Experimenters try to get people to respond honestly, but participants might distort their responses for any number of reasons.
In the last class, I gave you an example of researching whether faculty members might have an unconscious bias against women. Notice that the participants were not told that they were being studied for bias before their responses were collected. Indeed, if you asked the participating faculty directly, they would almost certainly have denied that they had any bias whatsoever. So, the experiment disguised how bias was going to be measured by NOT telling the participants what the independent variable was, that is, the applicant was either male or female. Is such deception justifiable or ethical?
The question of deception
- Many psychological studies hide or otherwise deceive participants during the course of the actual data collection.
- Critics say that (1) any deception is equivalent to lying, (2) deception undermines interpersonal trust, and (3) participants may feel stress either during the data collection or feel foolish after the experiment is explained to them.
- Supporters of deception argue that (1) very important issues cannot be investigated without some level of deception, (2) follow-up research does not find decreased interpersonal trust in participants, and (3) after carefully weighing the costs and benefits, the benefits are often worth the costs involved.
Animal Research
- Animals are used in research (1) to understand their natural behavior, (2) to identify general laws applying to both animals and humans, and (3) some experimental research would be clearly unethical if used with human beings because it would cause harm or pain to the human.
- Critics say that (1) animals have many rights up to and including the same rights as human beings, (2) many animal studies are trivial and produce no important results, and (3) some animal research findings don't have any use in understanding human behavior.
- Supporters of animal research argue that (1) very few psychological studies (7-8%) involves any animals (usually rodents or birds), (2) few animal studies actually inflict pain on the animals, (3) major advances helpful to human beings have been found through animal research (e.g., treatments for mental disorders, strokes, brain injuries, pain, etc.), and (4) research involves far fewer animals (1/10,000th) than the number of animals such as dogs and cats abandoned, killed, euthanized or otherwise harmed every year in America.
Ethical Principles in Research with Human Subjects
- Participation in research by people must be voluntary and they must be allowed to withdraw from a study at any time. Participants must give their written consent to participate in any research.
- There are multiple groups who cannot consent to research voluntarily, for example, children under 18 years of age; individuals with severe intellectual impairments; etc. In such cases, a legal guardian must give consent.
- Human participants in studies cannot be harmed or subject to dangerous treatments
- Note that in some medical (not psychological) research, very sick patients may be asked to participate in studies that may be dangerous to their health because that patient is already quite sick and the experimental treatment might be beneficial to them.
- If deception is used, all participants must be debriefed and told about the actual purpose of the experiment as soon as possible after it is finished
- Participants have a complete right to privacy and any identifying information must be removed from the results of a study
ReferencesDowns, A.C., & Lyons, P.M. (1991). Natural observations of the links between attractiveness and initial legal judgments. Personality and Social Psychology Bulletin, 17, 541-547. https://dx.doi.org/10.1177/0146167291175009
Gunnell, J. J., & Ceci, S. J. (2010). When emotionality trumps reason: A study of individual processing style and juror bias. Behavioral Sciences and the Law, 28, 850-877. https://dx.doi.org/10.1002/bsl.939
Reimer, N. K., Atari, M., Karimi-Malekabadi, F., Trager, J., Kennedy, B., Graham, J., & Dehghani, M. (2022). Moral values predict county-level COVID-19 vaccination rates in the United States. American Psychologist, 77(6), 743–759. https://doi.org/10.1037/amp0001020
![[Correlation]](../psy101graphics/Correlation.jpg)
![[Negative Correlation]](../psy101graphics/cor-1.gif)
![{Zero Correlation]](../psy101graphics/cor0.gif)
![[Positive Correlation]](../psy101graphics/cor_positive1.gif)