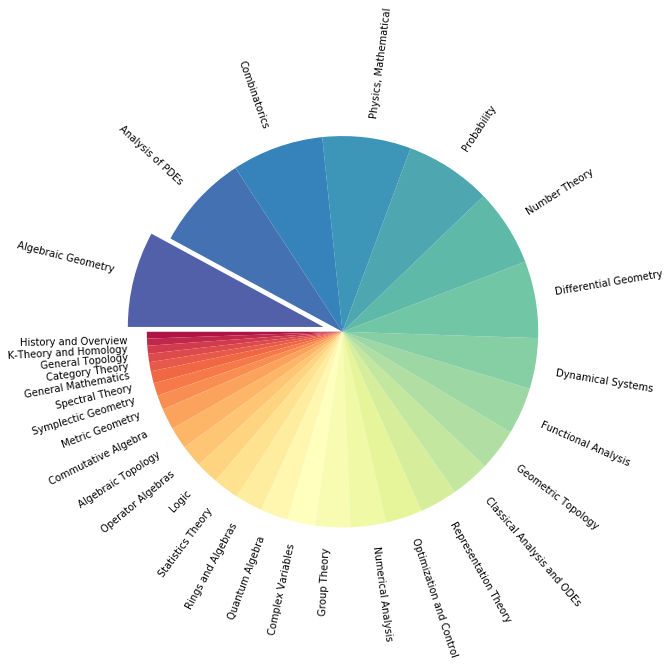
Complete count and proportion of articles submitted in each category (1992-2018)
Stacked area plots of number of articles contributed to the arXiv in each subject category.
Left -- All time (1992-2019), Middle -- Early days (1992-1997), Right -- After early (1998-2019).
Stacked area plots of proportion of articles contributed to the arXiv in each subject category.
Left -- All time (1992-2019), Middle -- Early days (1992-1997), Right -- After early (1998-2019).
Line plots of the number of articles contributed per year in each category over time.
Left -- All time (1992-2019), Middle -- Early days (1992-1997), Right -- After early (1998-2019).
.png)
.png)
.png)
.png)
.png)
.png)
.png)
.png)
.png)
.png)