Level: introductory (ex. 1), introductory+ (ex. 2), advanced (ex. 3)
References:
Notes: Lord Rayleigh (1842-1919, born John William Strutt) was awarded the 1904 Nobel Prize in physics for his role in the discovery of argon. That discovery resulted from his careful unraveling of an anomaly detected in gas density measurements.
Rayleigh's investigations that led to the discovery of argon began in attempts to measure the density of nitrogen with an eye toward accurate determination of its molar mass. He found small but reproducible discrepancies in the density of samples prepared from nitrogenous compounds ("chemical nitrogen") and samples prepared from atmospheric air ("atmospheric nitrogen").
This set of exercises is less about gas density, nitrogen, or argon than about precision and reproducibility of experimental data. Exercise 1 barely introduces the topic, simply calling for a calculation of the mean and standard deviation of multiple measurements. A teacher might well assign just exercise 1 as a prelab problem before a laboratory in which students are to make multiple measurements and assess the reproducibility of their measurements.
Exercise 2 goes one step beyond exercise 1 in that it asks students to make inferences from the assessment of precision. Formal education in statistics is not usually required of chemistry majors, although it is more frequently required of the biology majors that populate many introductory chemistry courses. At any rate, no formal statistical tests are needed to solve the problem--just the observation that the difference between chemical and atmospheric nitrogen is much greater than the differences within either category (which serve as some sort of measure of precision). The solution goes into formal statistics only so far as to mention the significance of the standard deviation with respect to the normal distrubtion. (For the interested instructor, a formal statistical test for exercise 2c is given below in these notes.) Exercise 2 is not too difficult for an introductory course. It may be better suited to the analytical chemistry course, however, because of its emphasis on data analysis.
Exercise 3, by contrast, requires more mathematical sophistication than a typical introductory course, as well as facility with mathematical and/or plotting software. (Of course exercise 3 cannot be given without exercise 2, but neither 2 nor 3 requires exercise 1.)
Formal statistical test for exercise 2c:[1] We have two sample means (mavg1 and mavg2) with sample sizes n1 and n2 and (sample) standard deviations s1 and s2. We are trying to judge whether the population means (that is the true means of the population of measurements that we have sampled) are in fact different. The appropriate test is the t-test for two population means. The statistic to be computed is called t, defined as
t = (mavg1 - mavg2)/(s12/n1 + s22/n2)1/2 .We must also calculate the "degrees of freedom" ν, defined as
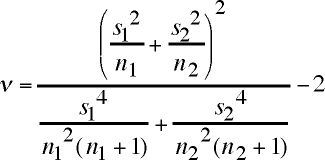
ν = (s12/n1 + s22/n2)2 / [s14/n12(n1+1) + s24/n22(n2+1)] - 2[HTML is pretty poor for mathematical typesetting, so here are graphics files of these equations.]
Plugging in the numbers yields t = 37.3 and ν = 5.1. We must refer to a table of critical values for the t distribution. If t is greater than the critical value, then the conclusion is that the population means are unequal. One can also assign a significance level to the conclusion. The critical value at the 0.005 significance level for five degrees of freedom (ν rounded to the nearest integer) is 4.032, meaning that if t were greater than or equal to the critical value, we would conclude that the population means are different (that chemical nitrogen and atmospheric nitrogen really have different masses), and we would expect such a conclusion to be correct 99.5% of the time. Since t is much greater than the critical value, we are very confident of the conclusion.and

Solutions: To download solutions, go to:
http://web.lemoyne.edu/giunta/classicalcs/rayleighN2.doc
To download a spreadsheet containing the calculation of the distribution functions, go to
http://web.lemoyne.edu/giunta/classicalcs/rayleighN2.xls
| Back to the Classic Calculations home page |
| Back to the top of the Classic Chemistry site |